
使用webgrind分析xdebug日志文件
先为你的PHP安装好xdebug,安装方法参考:
一、下载代码包
从Github下载压缩包,能下到最新的包
从国内的Gitee下载安装包,这也是从Github上镜像过来的,不一定是最新的
本站下载地址,更新于2023.1.9
二、解压代码并配置
解压压缩包后,你会发现,其实就是一套PHP的web系统,放到你的web服务器的目录下,修改配置文件config.php,
//配置webgrind的缓存目录,你想存哪里就设置成哪里
static $storageDir = '/data/webgrind/storage';
//设置xdebug文件的输出目录,需要与 php.ini 中 xdebug 的 xdebug.output_dir 设置一样的
//注意从 Xdebug 3开始配置不一样,我在配置 Xdebug 3 时只需要配置以下两项就可以跑起来了:
//xdebug.mode = profile          ;对应Xdebug 2的 xdebug.profiler_enable=on
//xdebug.output_dir="/data/xdebug"     ;对应Xdebug 2的 xdebug.profiler_output_dir="/data/xdebug"
static $profilerDir = '/data/xdebug';/data/xdebug
/data/webgrind/storage
三、配置虚拟主机
前面说了webgrind就是一个PHP的系统,所以只要为webgrind分配一个虚拟主机就可以访问了。我在Nginx中增加配置,给它分配一下域名进行访问:www.grind.com,记得在hosts中绑定ip和域名。
server {
listen 80;
server_name www.grind.com;
index index.php;
root /data/web/webgrind;
access_log /logs/www.grind.com.access.log main;
error_log /logs/www.grind.com.error.log;
location ~ .php$
{
#使用sock还是ip+端口,根据你自己的设置进行配置
#fastcgi_pass unix:/tmp/php-cgi.sock;
fastcgi_pass 127.0.0.1:9001;
fastcgi_index index.php;
# 设置脚本文件请求的路径
fastcgi_param SCRIPT_FILENAME $document_root$fastcgi_script_name;
# 引入fastcgi的配置文件
include fastcgi_params;
}
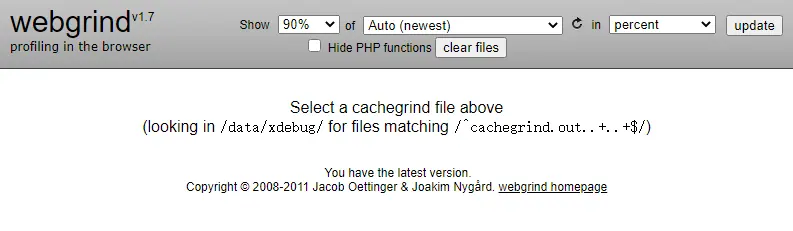
}四、查看分析报告
在浏览器里输入域名 www.grind.com 即可访问报告,界面如下
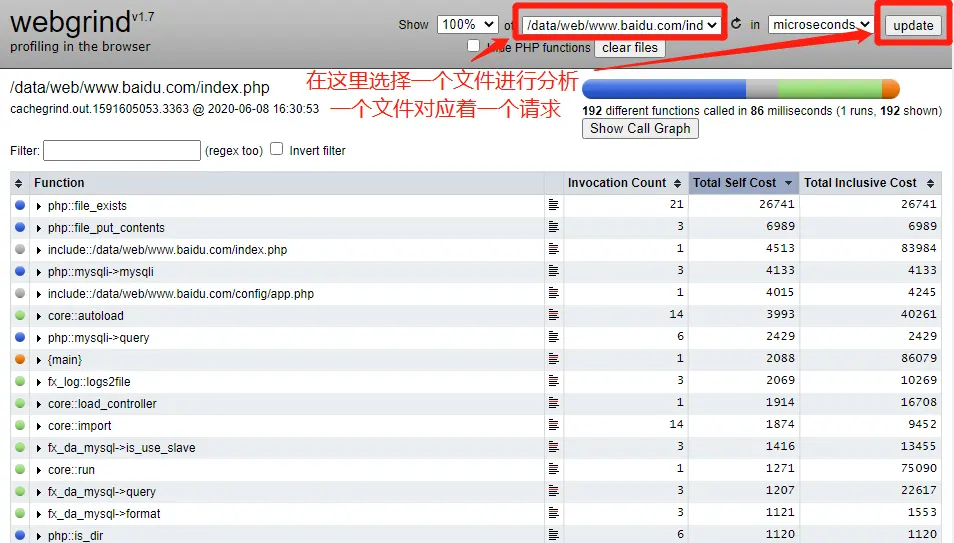
为了方便查阅时定位每一行的左右的内容,建议鼠标滑过表格的行时显示不一样的底色
在样式文件 /style/style.css 的第128行添加以下样式即可。
table.tablesorter tbody tr:hover{
        background-color: #B9CFE6;
}